Mathematical Connections.
As part of my AP Studio Art portfolio during my senior year of high school, I began a new series known as a concentration.
Along with art, math has always been one of my favorite subjects (even as senior struggling in multivariable calculus). After learning new theorems, equations, and formulas, I always want to know how these concepts related to the world around me and the things we encounter in everyday life. For me, a big part of that is visual. Through my exploration, I realized that while numbers are complicated, they can also be really pretty, My concentration focuses on this idea.
The following body of work centers on the intersection of mathematics, art, and everyday life. Taking inspiration from da Vinci's polyhedron drawings and Brunelleschi's experiment of linear perspective, I aimed to reveal the hidden beauty of numbers. I took the theoretical, abstract elements of mathematics and transformed them into concrete representations of line and color. From rose curves to the golden ratio, math illustrates the infinite potential of art, and I strive to share this idea with others.
”Painting is a science and all sciences are based on mathematics.”
-Leonardo daVinci
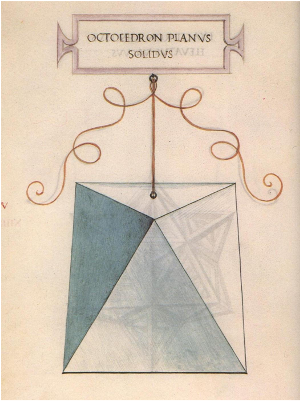
Divina Proportione (Divine Proportion) by daVinci
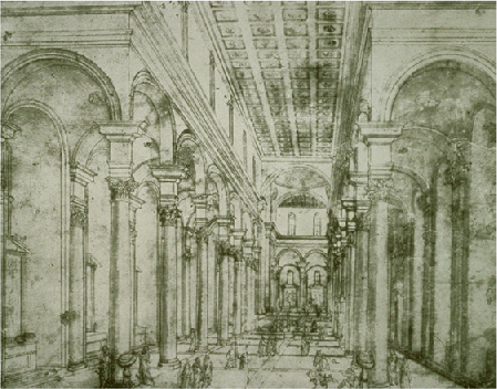
Leon Battista Alberti/Filippo Brunelleschi

The Vitruvian Man

Pablo Picasso
Research
Before beginning my concentration, I first conduced preliminary research of artists in history with mathematical inspiration and implications in their artwork.
One of the most well known artists is Leonardo daVinci, who was not only an artist but also a scientist and a mathematician. Among his most famous drawings is the Vitruvian Man, where he illustrated human proportions and anatomy by using mathematics to describe the perfect physical features of a man. He also illustrated a book called Divine Proportion which included drawings of over 60 geometric shapes. Other notable artists are Alberti and Brunelleschi, who together developed the fundamentals of linear perspective and the vanishing point. These concepts are very relevant to architectural drawing, both within buildings and on streets. Lastly, even Pablo Picasso’s cubist work has some relation to mathematics due to its use of geometric shapes.

The Golden Ratio
The golden ratio is very closely related to something called the Fibonacci Sequence, which is the series of numbers 0, 1, 1, 2, 3, 5, 8, 13, 21, 34,..., where the next number is found by adding up the two numbers before it.
When we take any two successive Fibonacci Numbers, their ratio is very close to the Golden Ratio, which is approximately 1.618034. In fact, the bigger the pair of Fibonacci Numbers, the closer the approximation.
In geometry, the Golden Ratio can be used to create a spiral known as the golden spiral, a logarithmic spiral whose growth factor is the golden ratio. In other words, the golden spiral gets wider by a factor of 1.618034… for every quarter turn it makes.
Some artists and architects believe the Golden Ratio makes the most pleasing and beautiful shape. In fact, the golden ratio can be found in nature all around us: in plants, flowers, and even in skeletons. Some studies have even shown that the most attractive and visually pleasing faces follow the golden ratio. For example, many scholars believed that daVinci used the golden ratio when painting one of his most famous works, the Mona Lisa.
In this drawing, I showed how the golden ratio is even apparent in one of the most basic body parts: the ear.
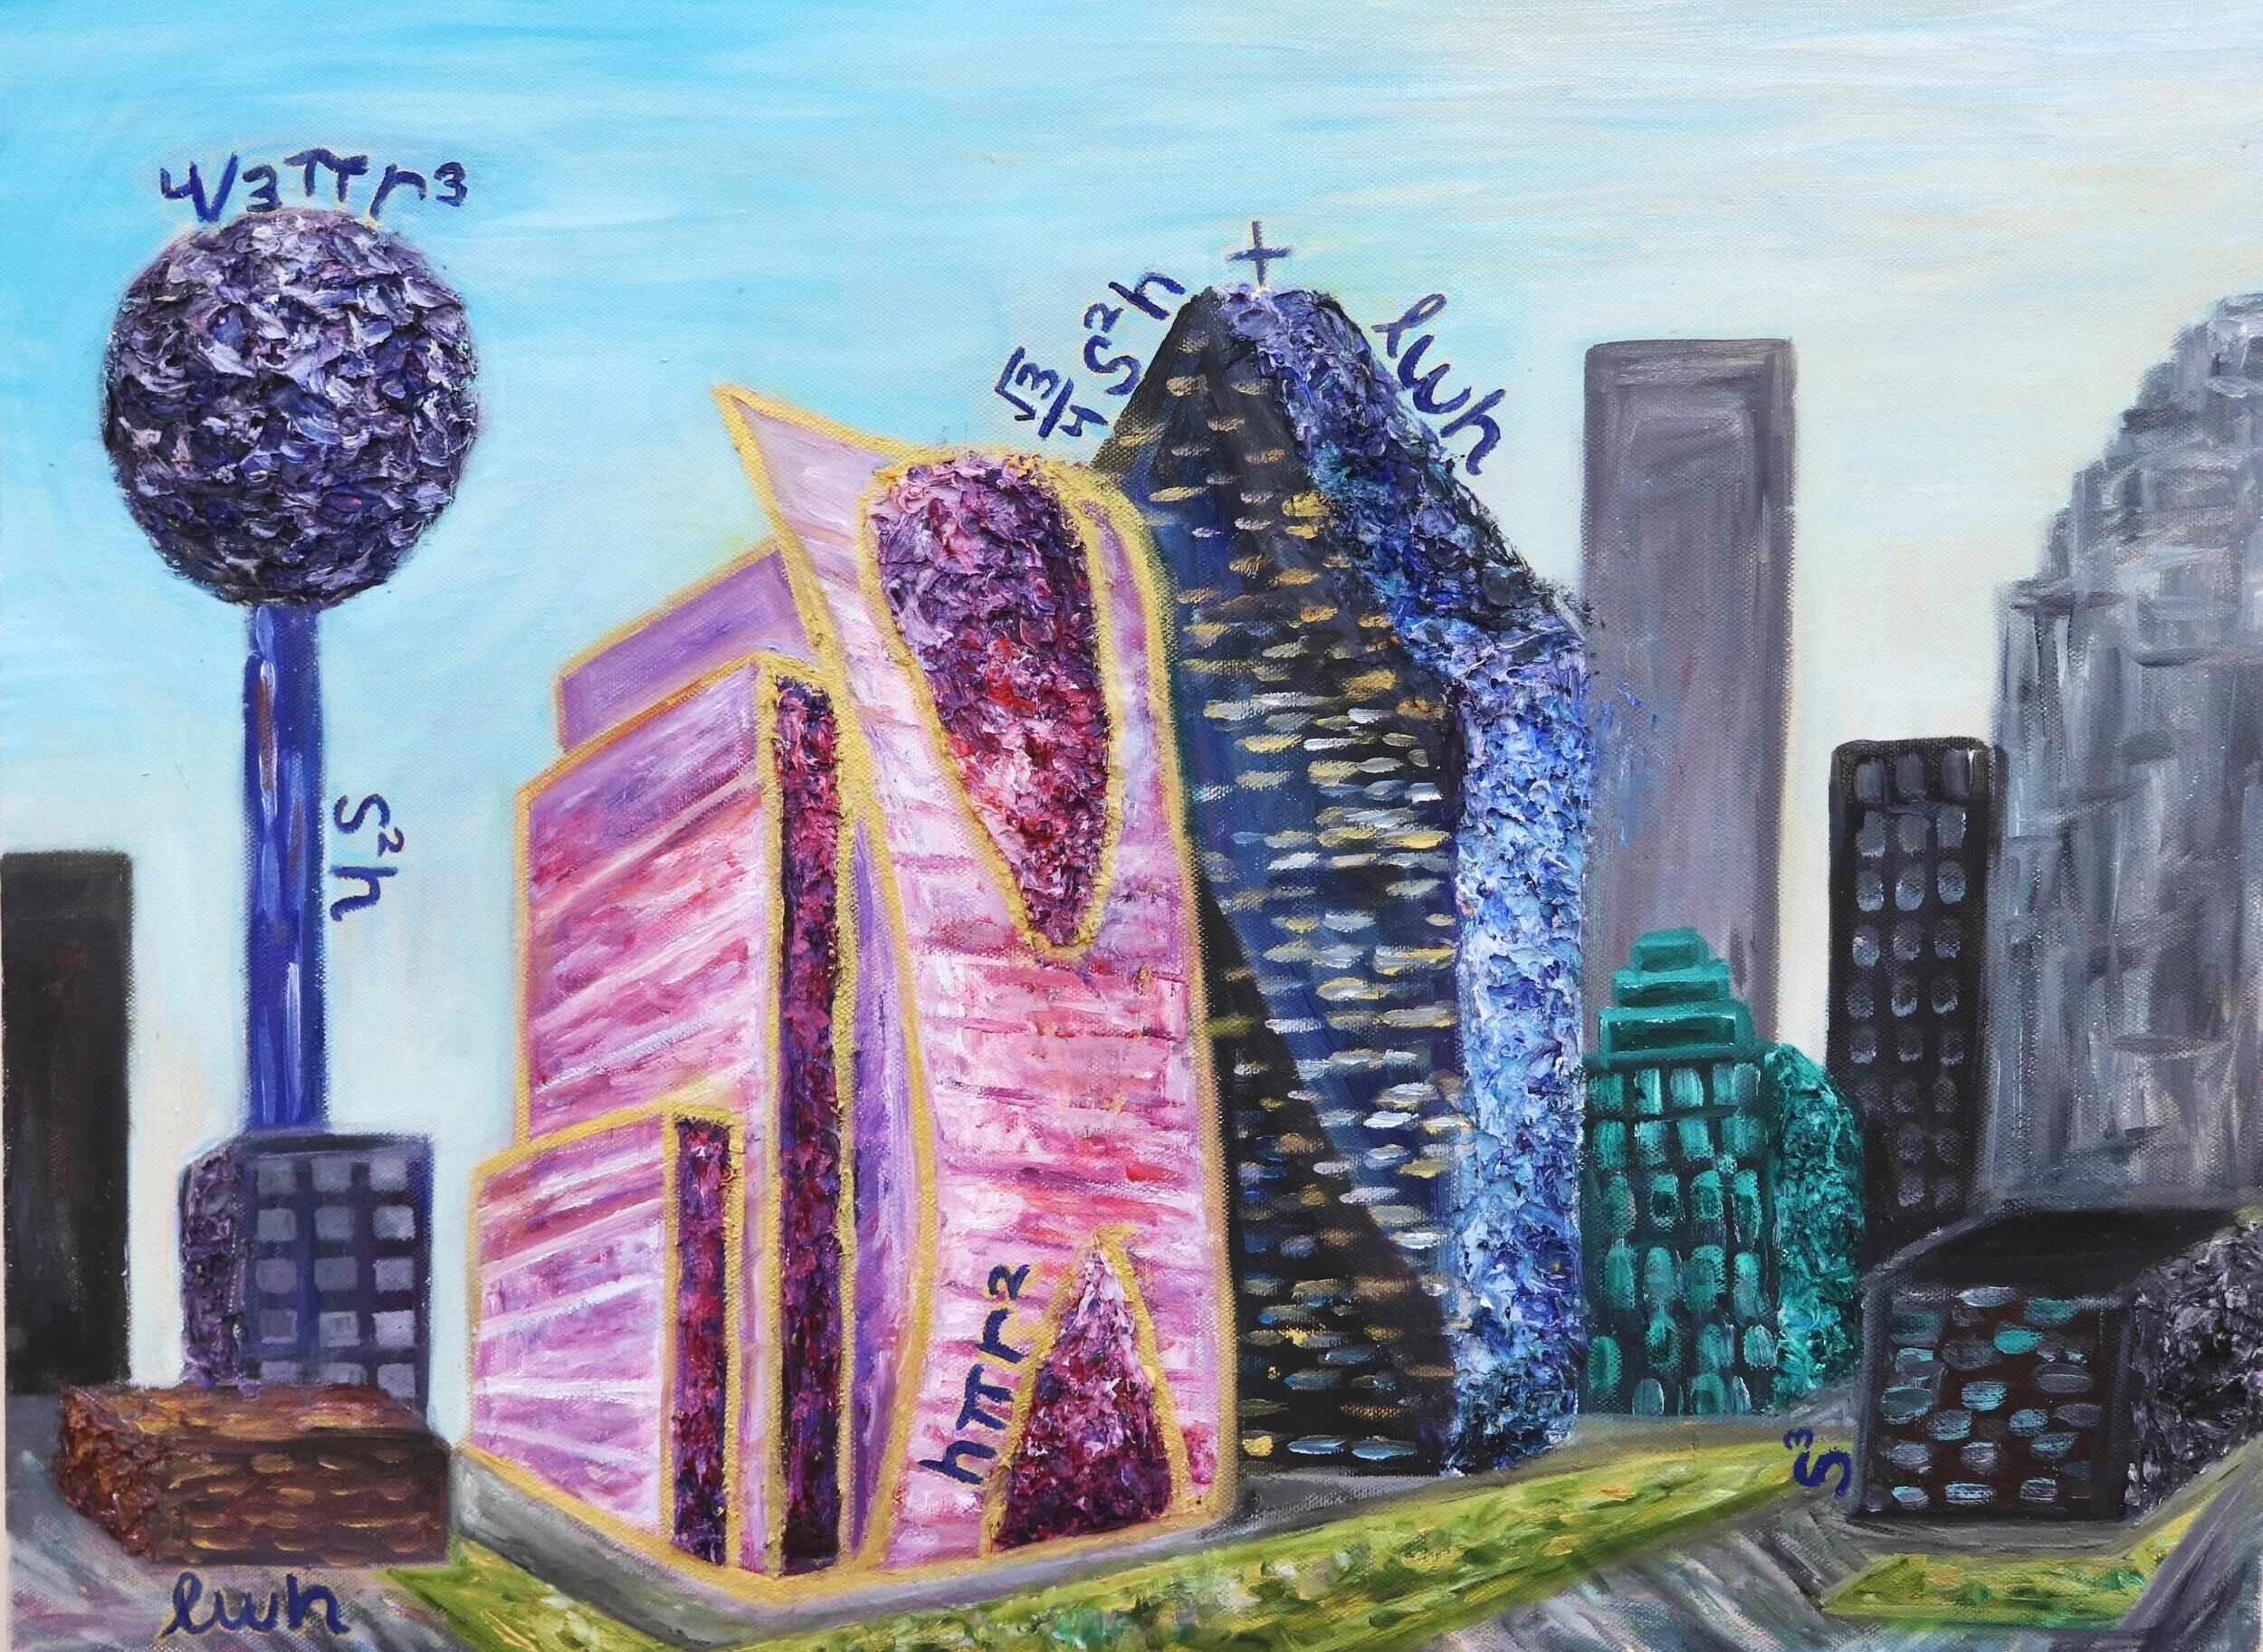
Quadric Surfaces.
Mathematically, quadric surfaces are the graphs of any equation that can be put into the general form:
Ax^2+By^2+Cz^2+Dxy+Exz+Fyz+Gx+Hy+Iz+J=0
Each of these equations corresponds to a different 3D structure.
There are countless quadric surfaces, but some of the most common depict shapes very similar to everyday objects, a few of which I explored to the left.

The Pringle
(Hyperbolic Paraboloid)
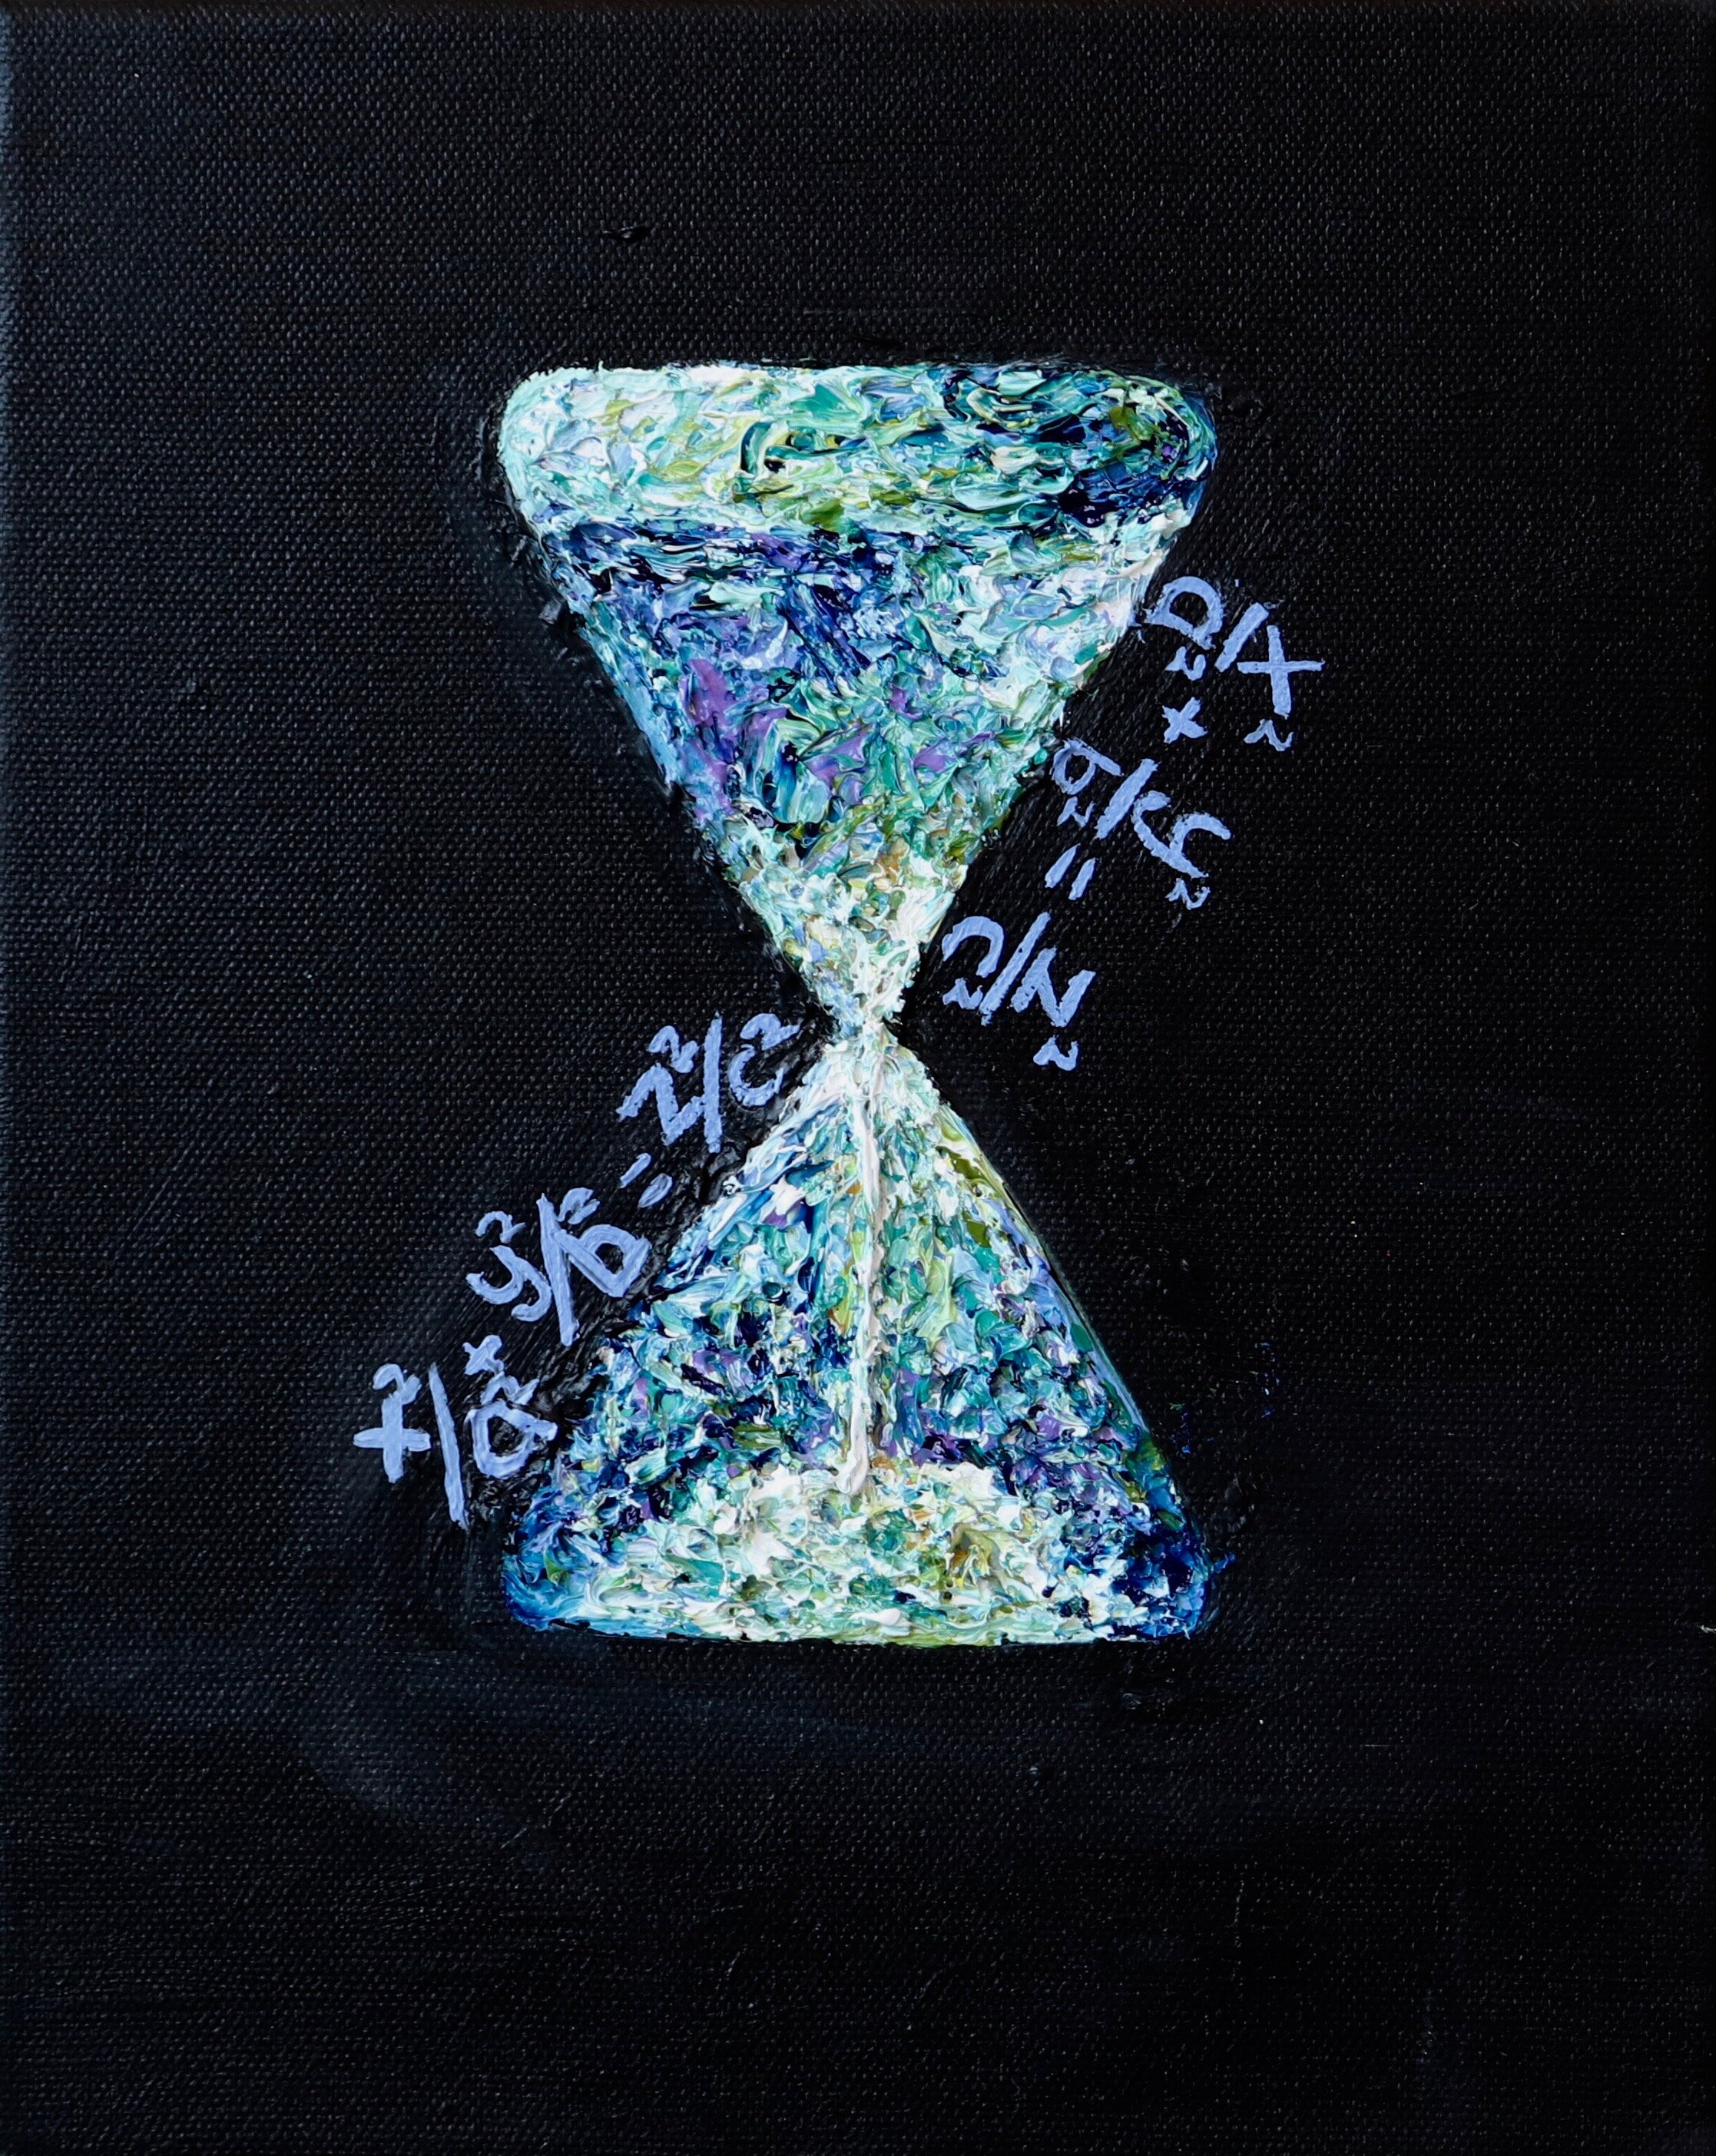
Hour Glass
(Elliptic Cone)

Fractals.
As my concentration evolved, my work became more abstract. I started focusing more on the pretty patterns that come from mathematics. One of these patterns are fractals, super complex patterns that are created by repeating the same process over and over. Overall, a fractal is a curve or geometric figure, each part of which has the same statistical character as the whole.
Through this piece, I depict the aesthetically pleasing, infinite patterns fractals can create. I aimed to create a fractal both within each canvas as well as through the shape of the canvases themselves.
Contour Maps
Contour maps are derived from functions of the form z = f(x, y). When these functions are graphed, they represent a set of points (x,y,z) and create a 3D structure.
From these functions, we can create level curves. Now, let me try to explain: Suppose the graph above is intersected by a plane z = k, parallel to the xy-plane. This is equivalent to holding z constant and reducing the equation to f(x, y) = k . In a level curve, x and y can vary, but z does not change. Thus, this curve is parallel to the xy-plane. As an analogy, imagine standing on a hill and taking a step such that you neither go uphill nor downhill. If you do this repeatedly, you will all the way around the hill along a path that is level, and end at the same point from which you started. This would be one of many level curves on the hill.
A level curve projected onto the xy-plane is called a contour. Because a function has many level curves, one for each possible value of z, there are also many possible contours. A contour map is created from a set these contours. Thus, a contour map shows the various level curves that are created from a function when z is set to different values. Often these contour maps can be quite beautiful and intricate.
To the right, I painted one example of a contour map. My goal was to create an abstract piece of art that could easily fit in someone’s home or office but simultaneously contained a hidden mathematical construction.

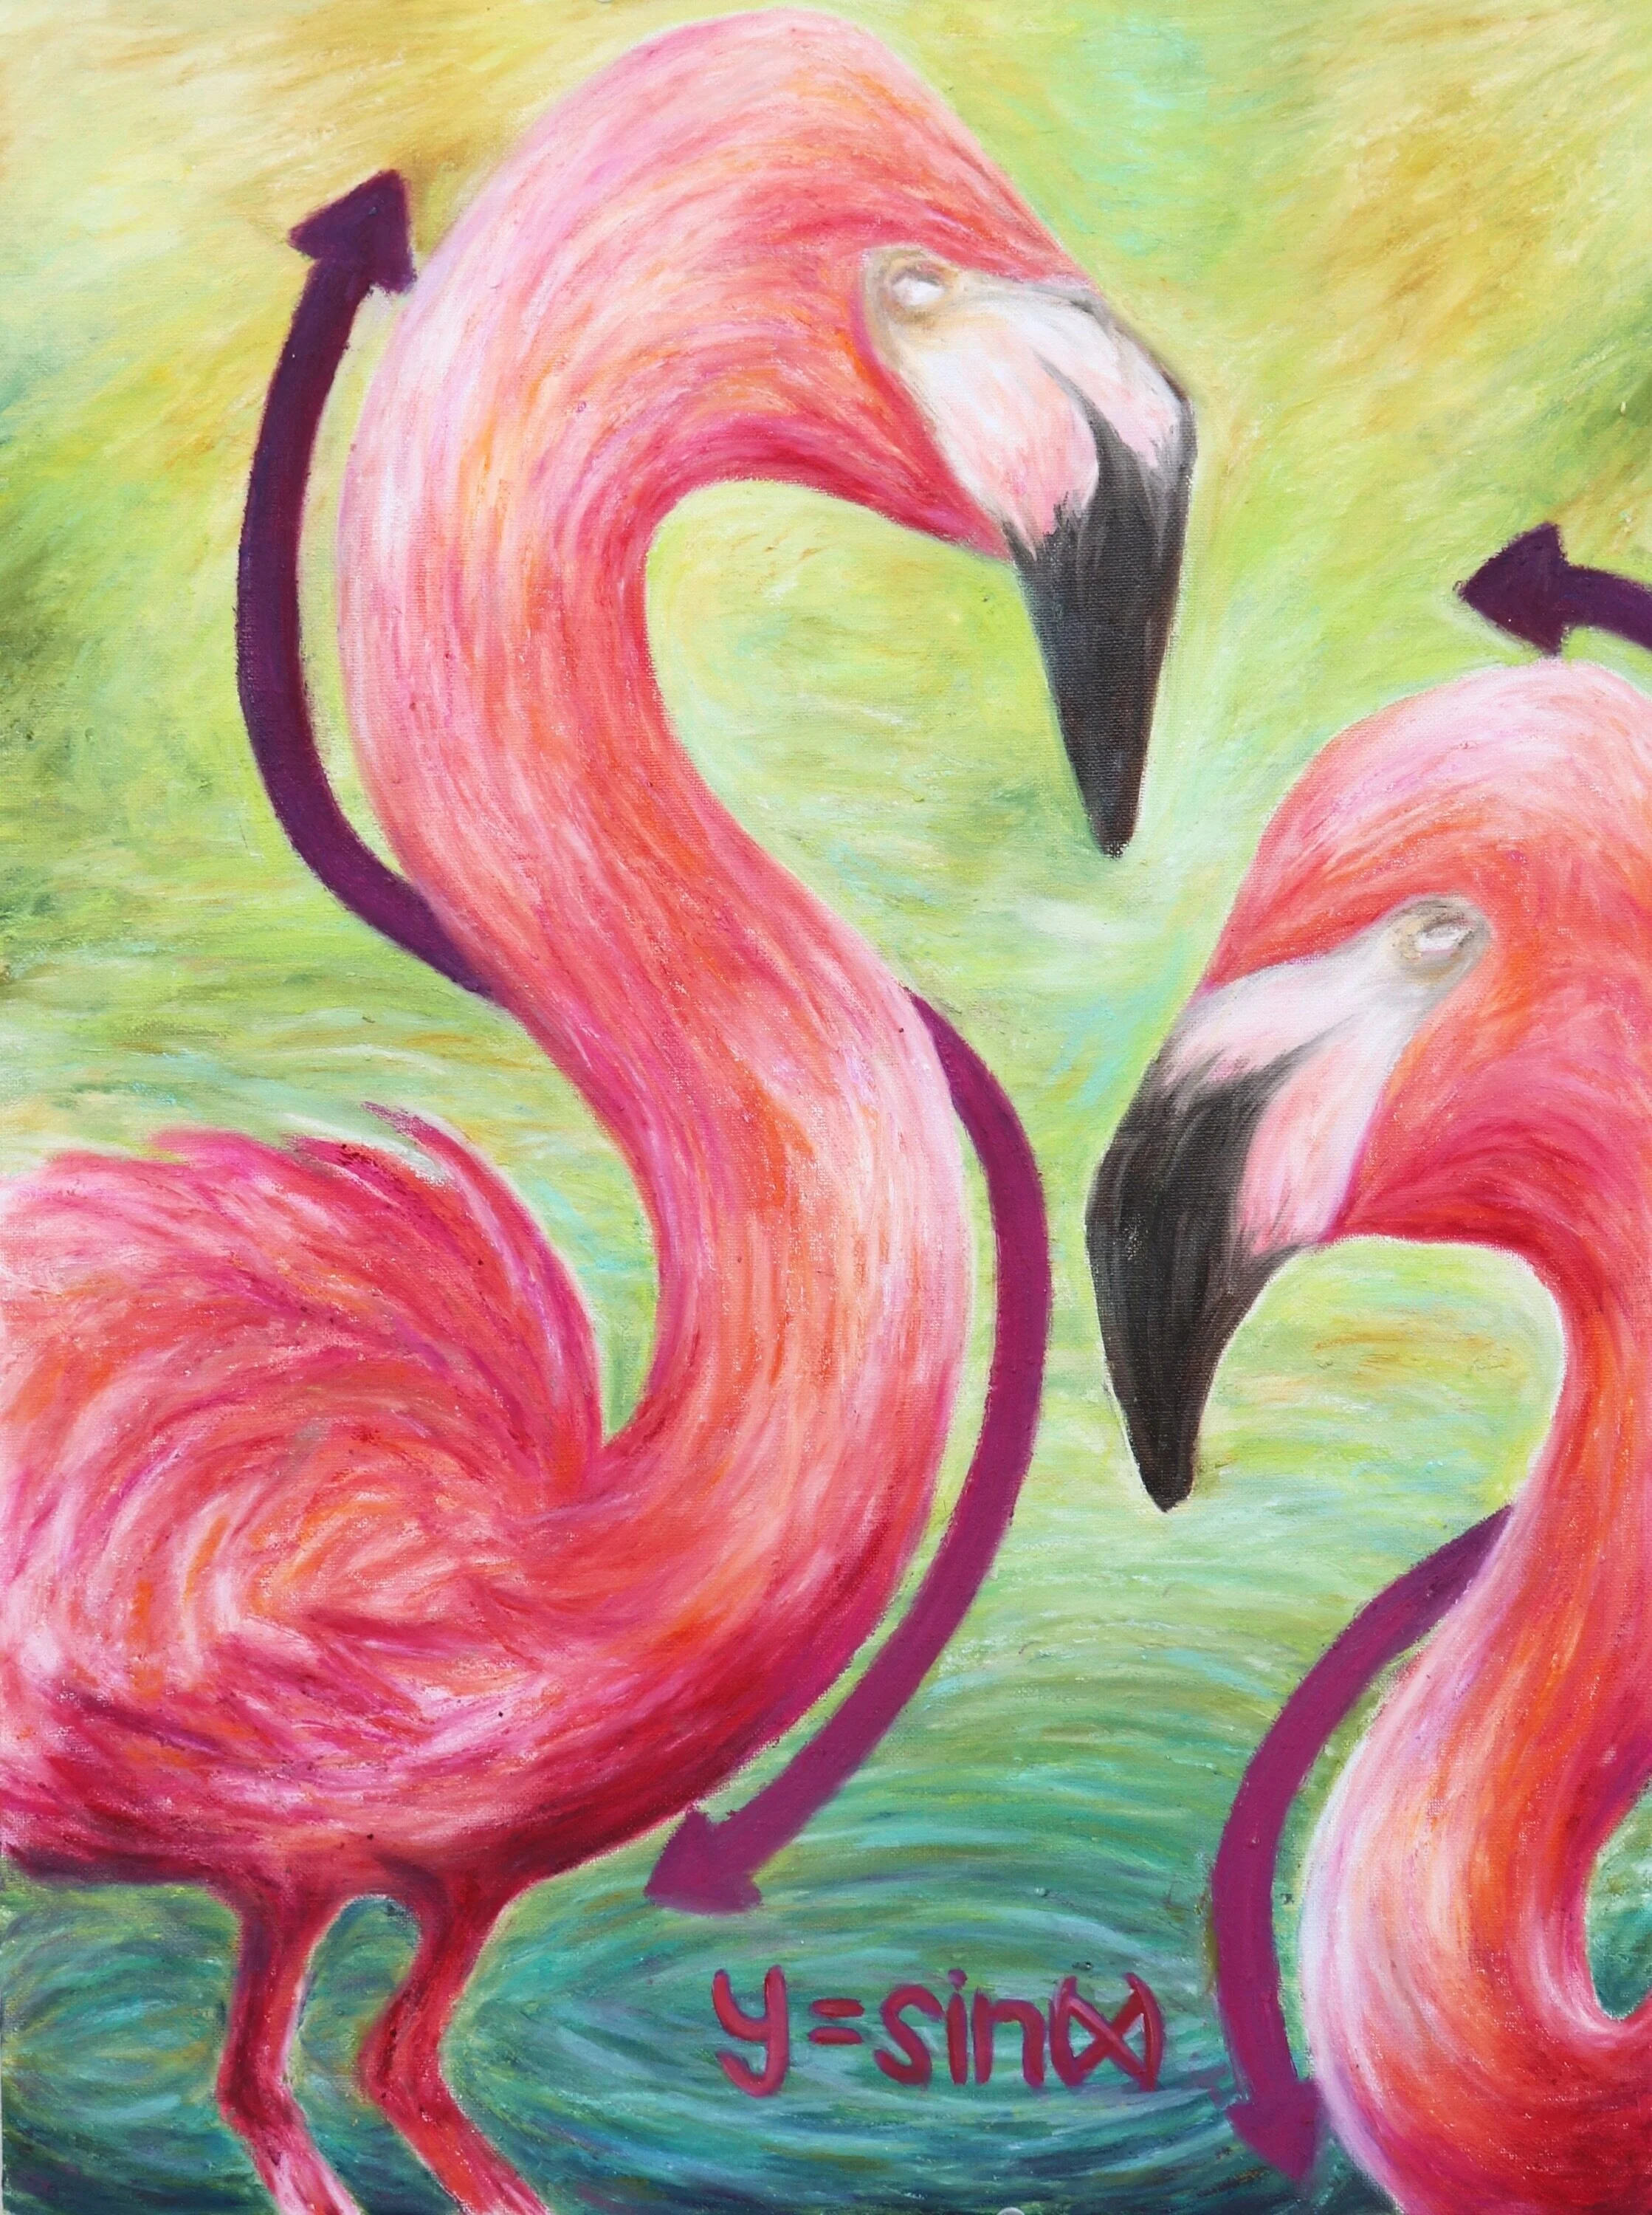
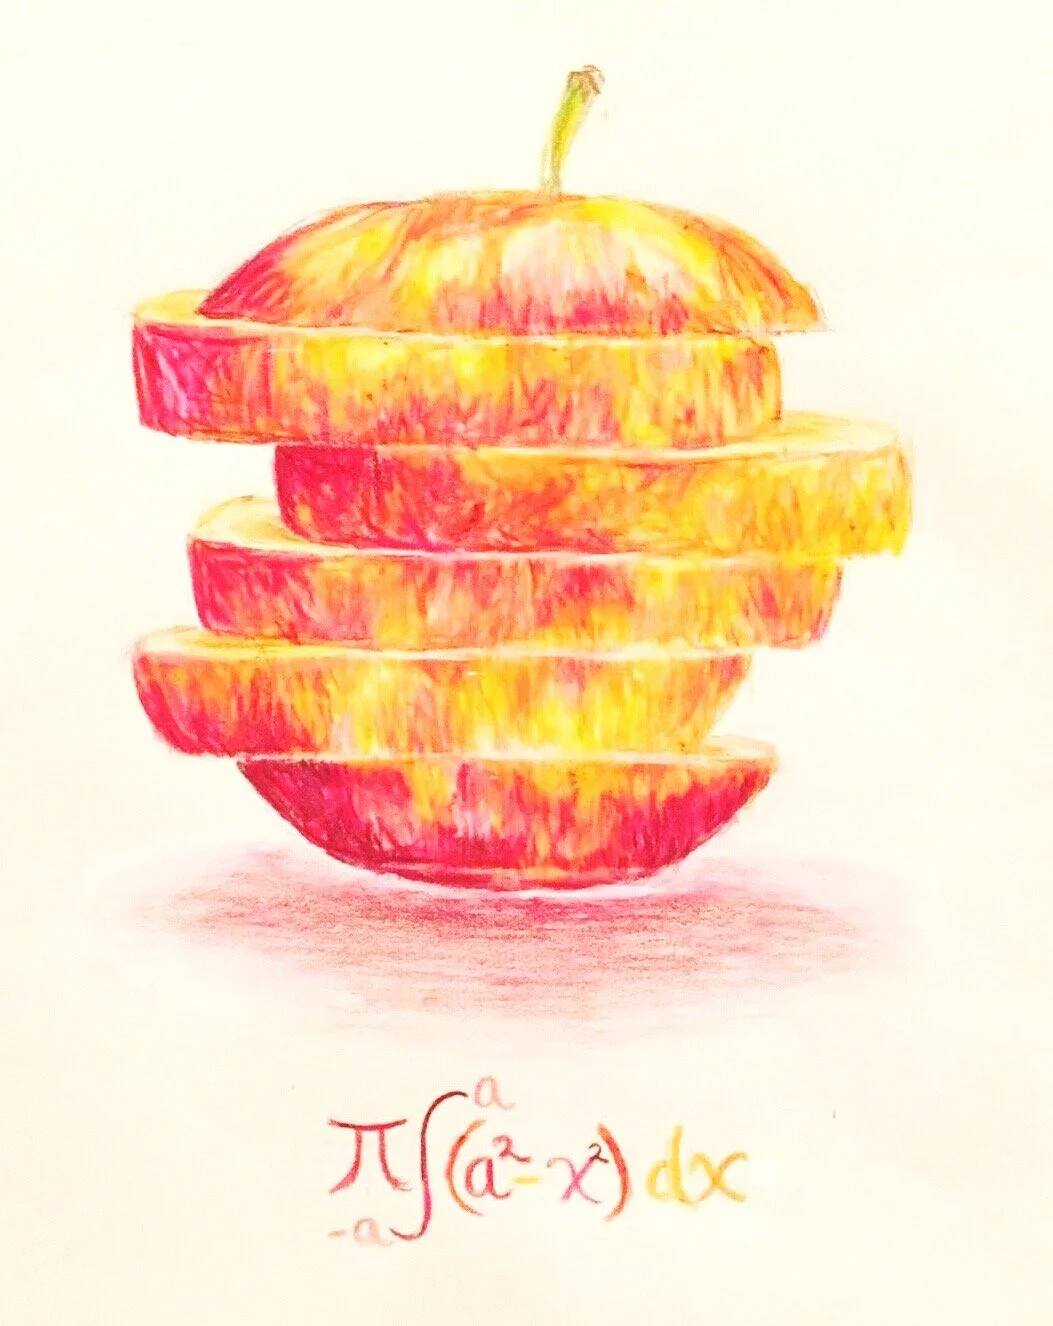
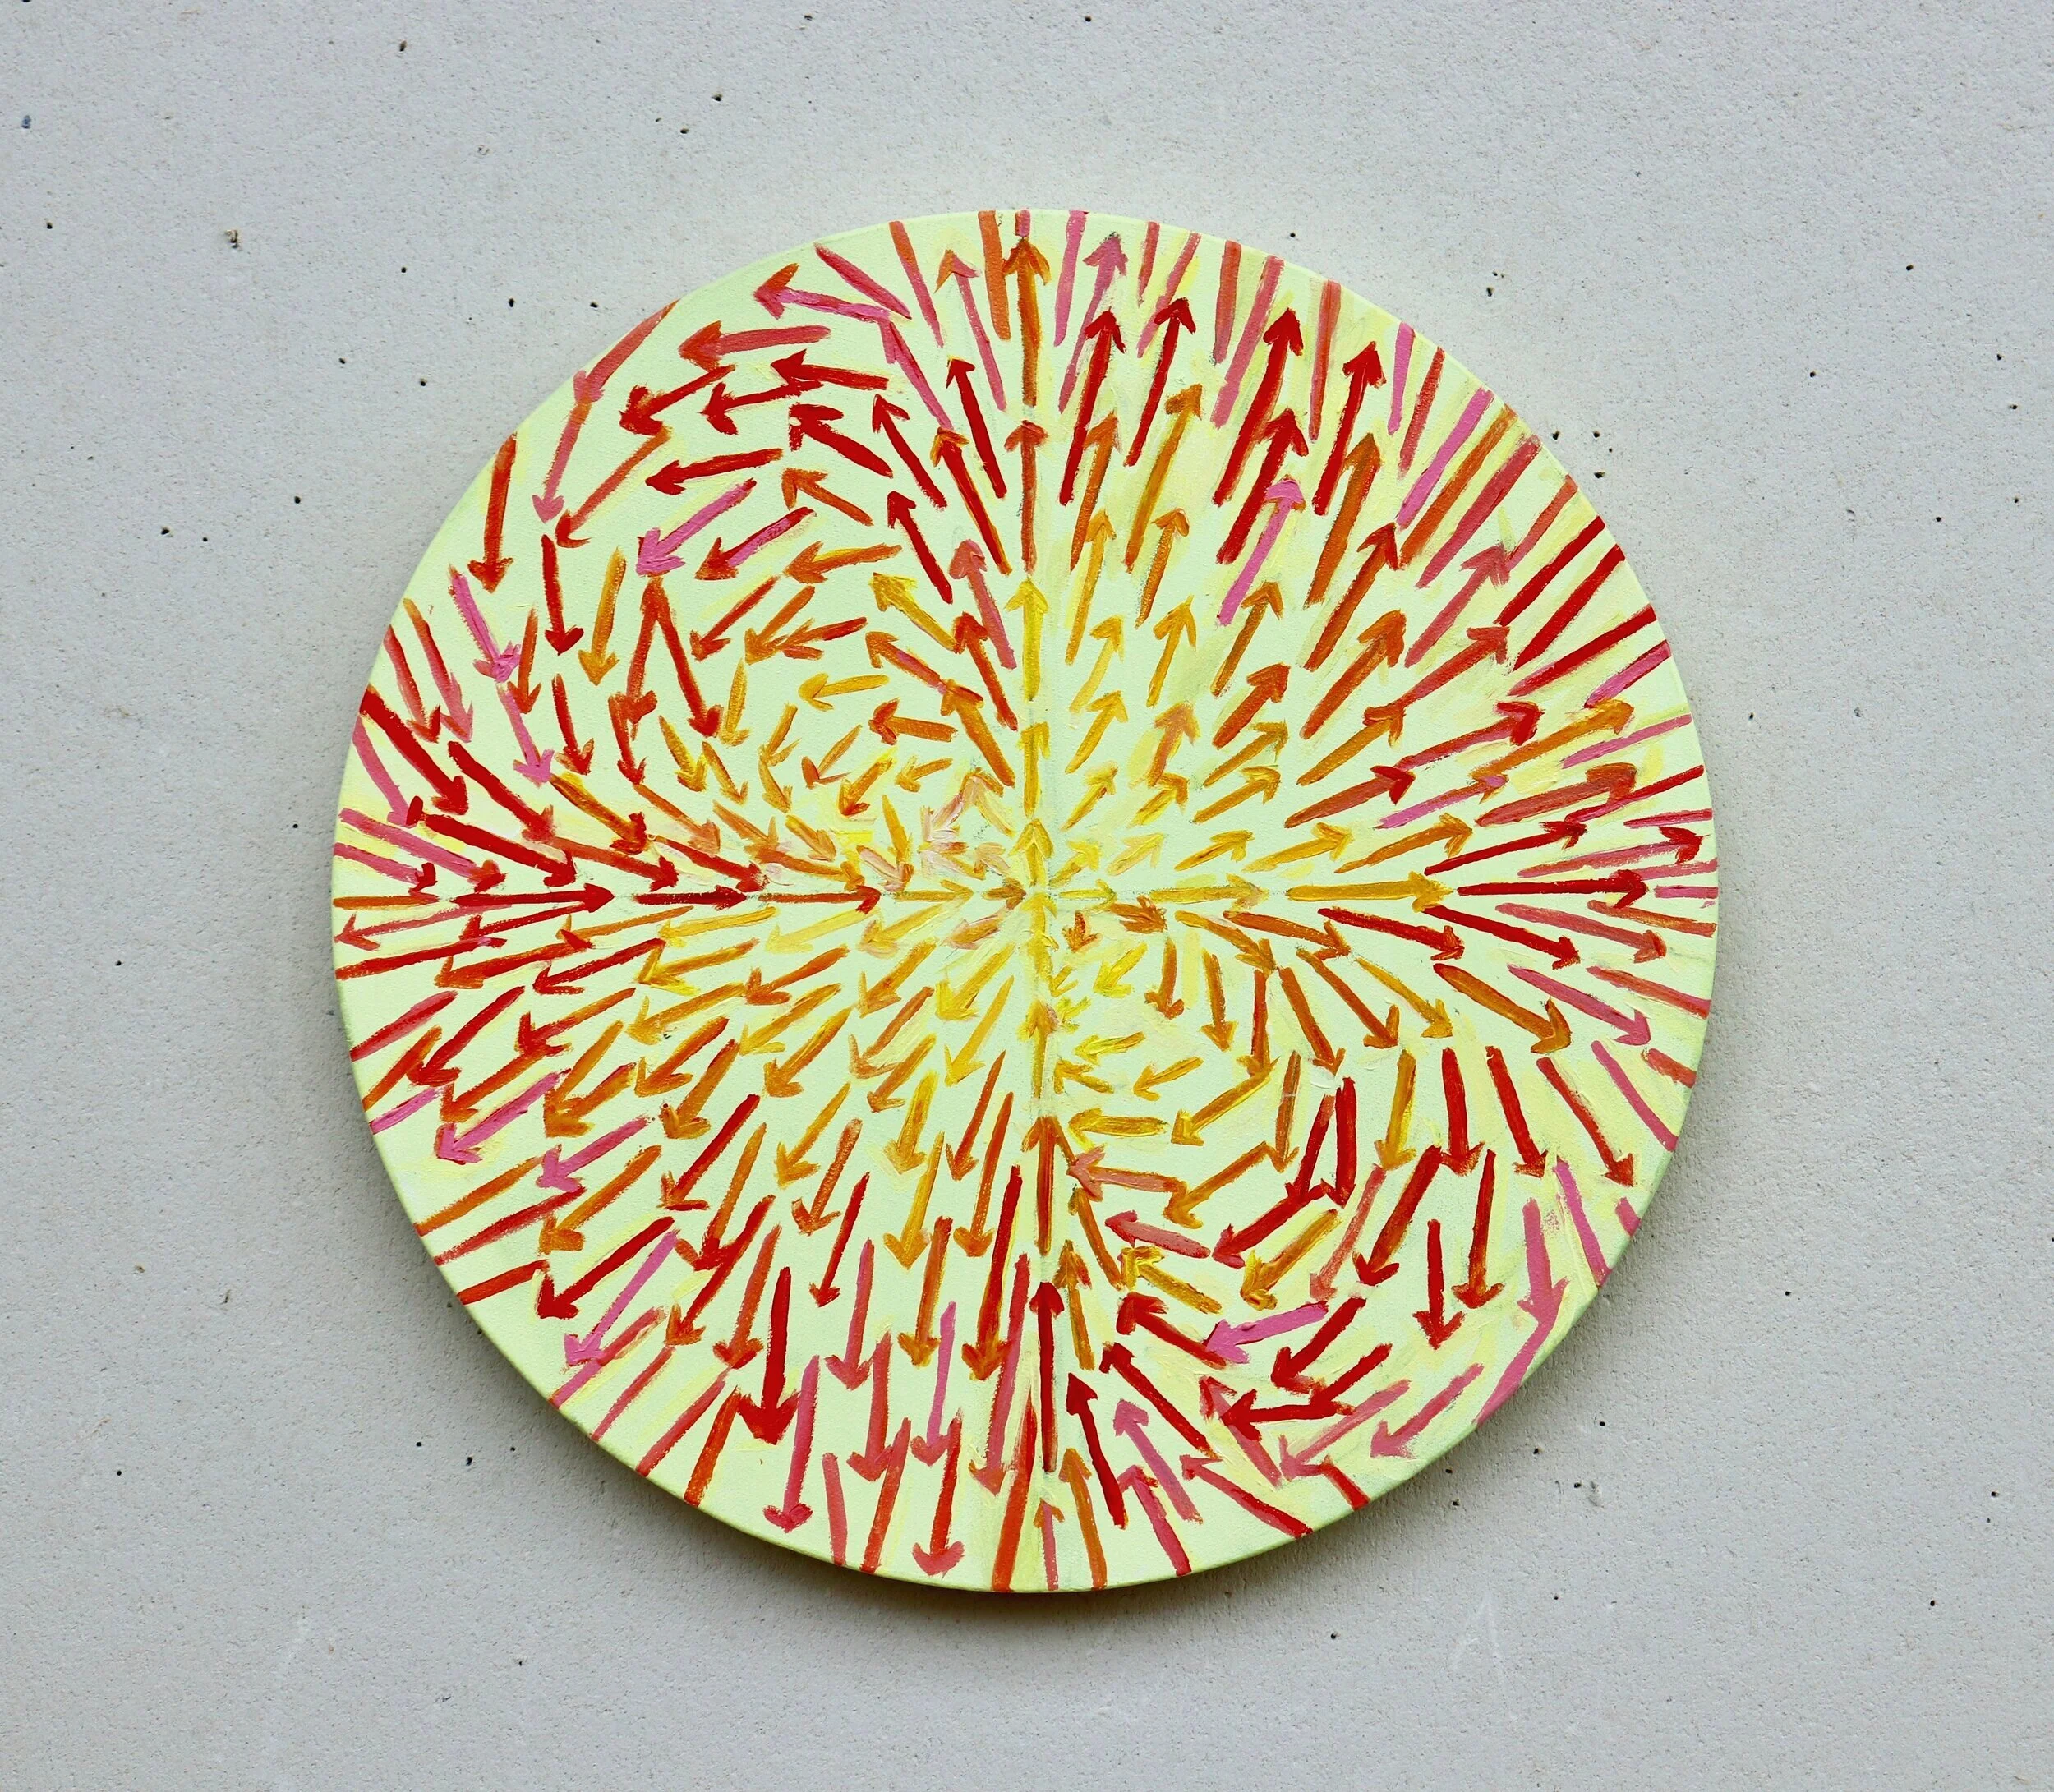
Other Works.
These pieces explore mathematical concepts including trigonometric curves, integration techniques used to find volume, polar curves (rose curves), vector valued functions, and 3-D objects.